Charty McCharterson
I knew that all of that work that I did on polls would come in handy at some point. The time arrived, as displaying data was something that seemed important from the beginning, to support the goals for the project. I wanted to support the information about ‘UK smart device ownership’ with some data. Having spent quite a bit of time looking at polling options and trying things out, I felt sure that the the Google Charts api (n.d.) would give me the level of interactivity and customisation required.
Something I changed
Like the tools I had used already (see earlier entries including Flickity by metafizzy (2016), smooth-scroll by cfernandi (2016)) the instructions always say to call the JavaScript package in the header. This is something that my instructor, Marcus, had pointed out as bad practice. Therefore, I created a new eventlistener in my JavaScript file in order to load google’s “loader.js” script. This allowed me to place the ’ tag at the bottom of my index.html file. However, unlike the other widgets and code snippets that I have used, I cannot compile Google’s JavaScript as part of my own script (Google, 2016a), it has to be loaded from Google servers (licensed under Apache license version 2.0 (2004) ). For this reason I reused the loading GIF from the contact form, to show while the chart loads. The data itself is from Offcom’s report entitled, The Communications Market, 5 Internet and Online Content (2016a, p. 191). What is great about their site is that they make the raw data available in Microsoft Excel format, so I was able to construct the chart based on a subset of data (Ofcom, 2016b). In order to show the age versus ownership I selected a stacked barchart as a space efficient way to show the data.
Prepping the chart for print
I have still to create my print stylesheet, which is something that I will do towards the end of the project. In the meantime it made sense to make sure that the chart was prepped for printing to png. I am not going to make a link to the png available as that function will run in browsers which support the HTML5 element (Google, 2016c). However, what customising this script did do, was create a static view of the chart showing it in suitable format for printing.
Tab clear
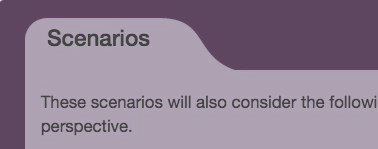
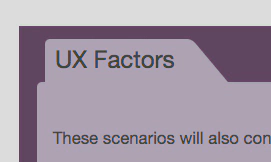
I decided that I needed to highlight the User Experience section of the portfolio page design, as it was all very wordy. There is still a lot to consider in this area, but I decided to add a tab image on the top-left of the UX factors (formerly scenarios) section. I started by creating an svg, partially inspired by a post on CSS-Tricks (Coyier, 2013). However, I really wasn’t happy with it in terms of formatting and scaling. For now I have replaced it with a tab which I created using pure CSS. The tab is actually made of two divs, one for the the main tab shape (rounded rectangle) and one for the slant leading up to it using the skewX transform option. However, I will have to replace this as it is only compatible with IE11 or later (Can I use, 2016). It is a shame, but it was good to learn about the transform option and again I used the ::before pseudo element to add text content on the div.
References
Apache Software Foundation. (2004). Apache license version 2.0. Retrieved January 7, 2017, from Apache Software Foundation website, http://www.apache.org/licenses/LICENSE-2.0
Can I use… (2016, October 23). Retrieved January 7, 2017, from http://caniuse.com/#search=transform
Coyier, C. (2013, December 4). SVG tabs (using an SVG shape as template) [Blog post]. Retrieved from https://css-tricks.com/svg-tabs-using-svg-shape-template/
cferdinandi. (2016, December 11). Cferdinandi/smooth-scroll. Retrieved December 11, 2016, from https://github.com/cferdinandi/smooth-scroll
Google. (n.d.). Charts | Google developers. Retrieved January 7, 2017, from Google Charts, https://developers.google.com/chart/
Google. (2016a, September 12). Load the libraries. Retrieved January 7, 2017, from Google Charts, https://developers.google.com/chart/interactive/docs/basic_load_libs#limitations
Google. (2016b, September 12). Bar charts. Retrieved January 7, 2017, from Google Charts, https://developers.google.com/chart/interactive/docs/gallery/barchart#stacked-bar-charts
Google. (2016c, October 12). Printing PNG charts. Retrieved January 7, 2017, from Google Charts, https://developers.google.com/chart/interactive/docs/printing
metafizzy. (2016). Flickity. Retrieved January 15, 2017, from http://flickity.metafizzy.co/
Ofcom. (2016a). The Communications Market 2016: 5 Internet and online content. Retrieved from https://www.ofcom.org.uk/research-and-data/cmr/cmr16/the-communications-market-report-uk
Ofcom. (2016b, August 4). Data downloads. Retrieved January 7, 2017, from Ofcom.org.uk, https://www.ofcom.org.uk/research-and-data/cmr/cmr16/downloads
Fiona MacNeill
Learning Consultant & UX Designer
Passionate about creating inclusive and accessible experiences, tools, and services for learning and doing.