ePortfolio System (2017-20)
Introduction
This usability evaluation was part of an annual report and was repeated over two years. The evaluation looked at the experience of three groups of ePortfolio system users, across two universities’ Social Work programmes and their external student work placement providers. The anonymised data which was collected and analysed allowed for improvements to user journeys, processes, and system information architecture. The changes made led to an increased usability rating from the user groups based on the scale used.
Client
University of Brighton as the owner of the ePortfolio platform and service.
Background
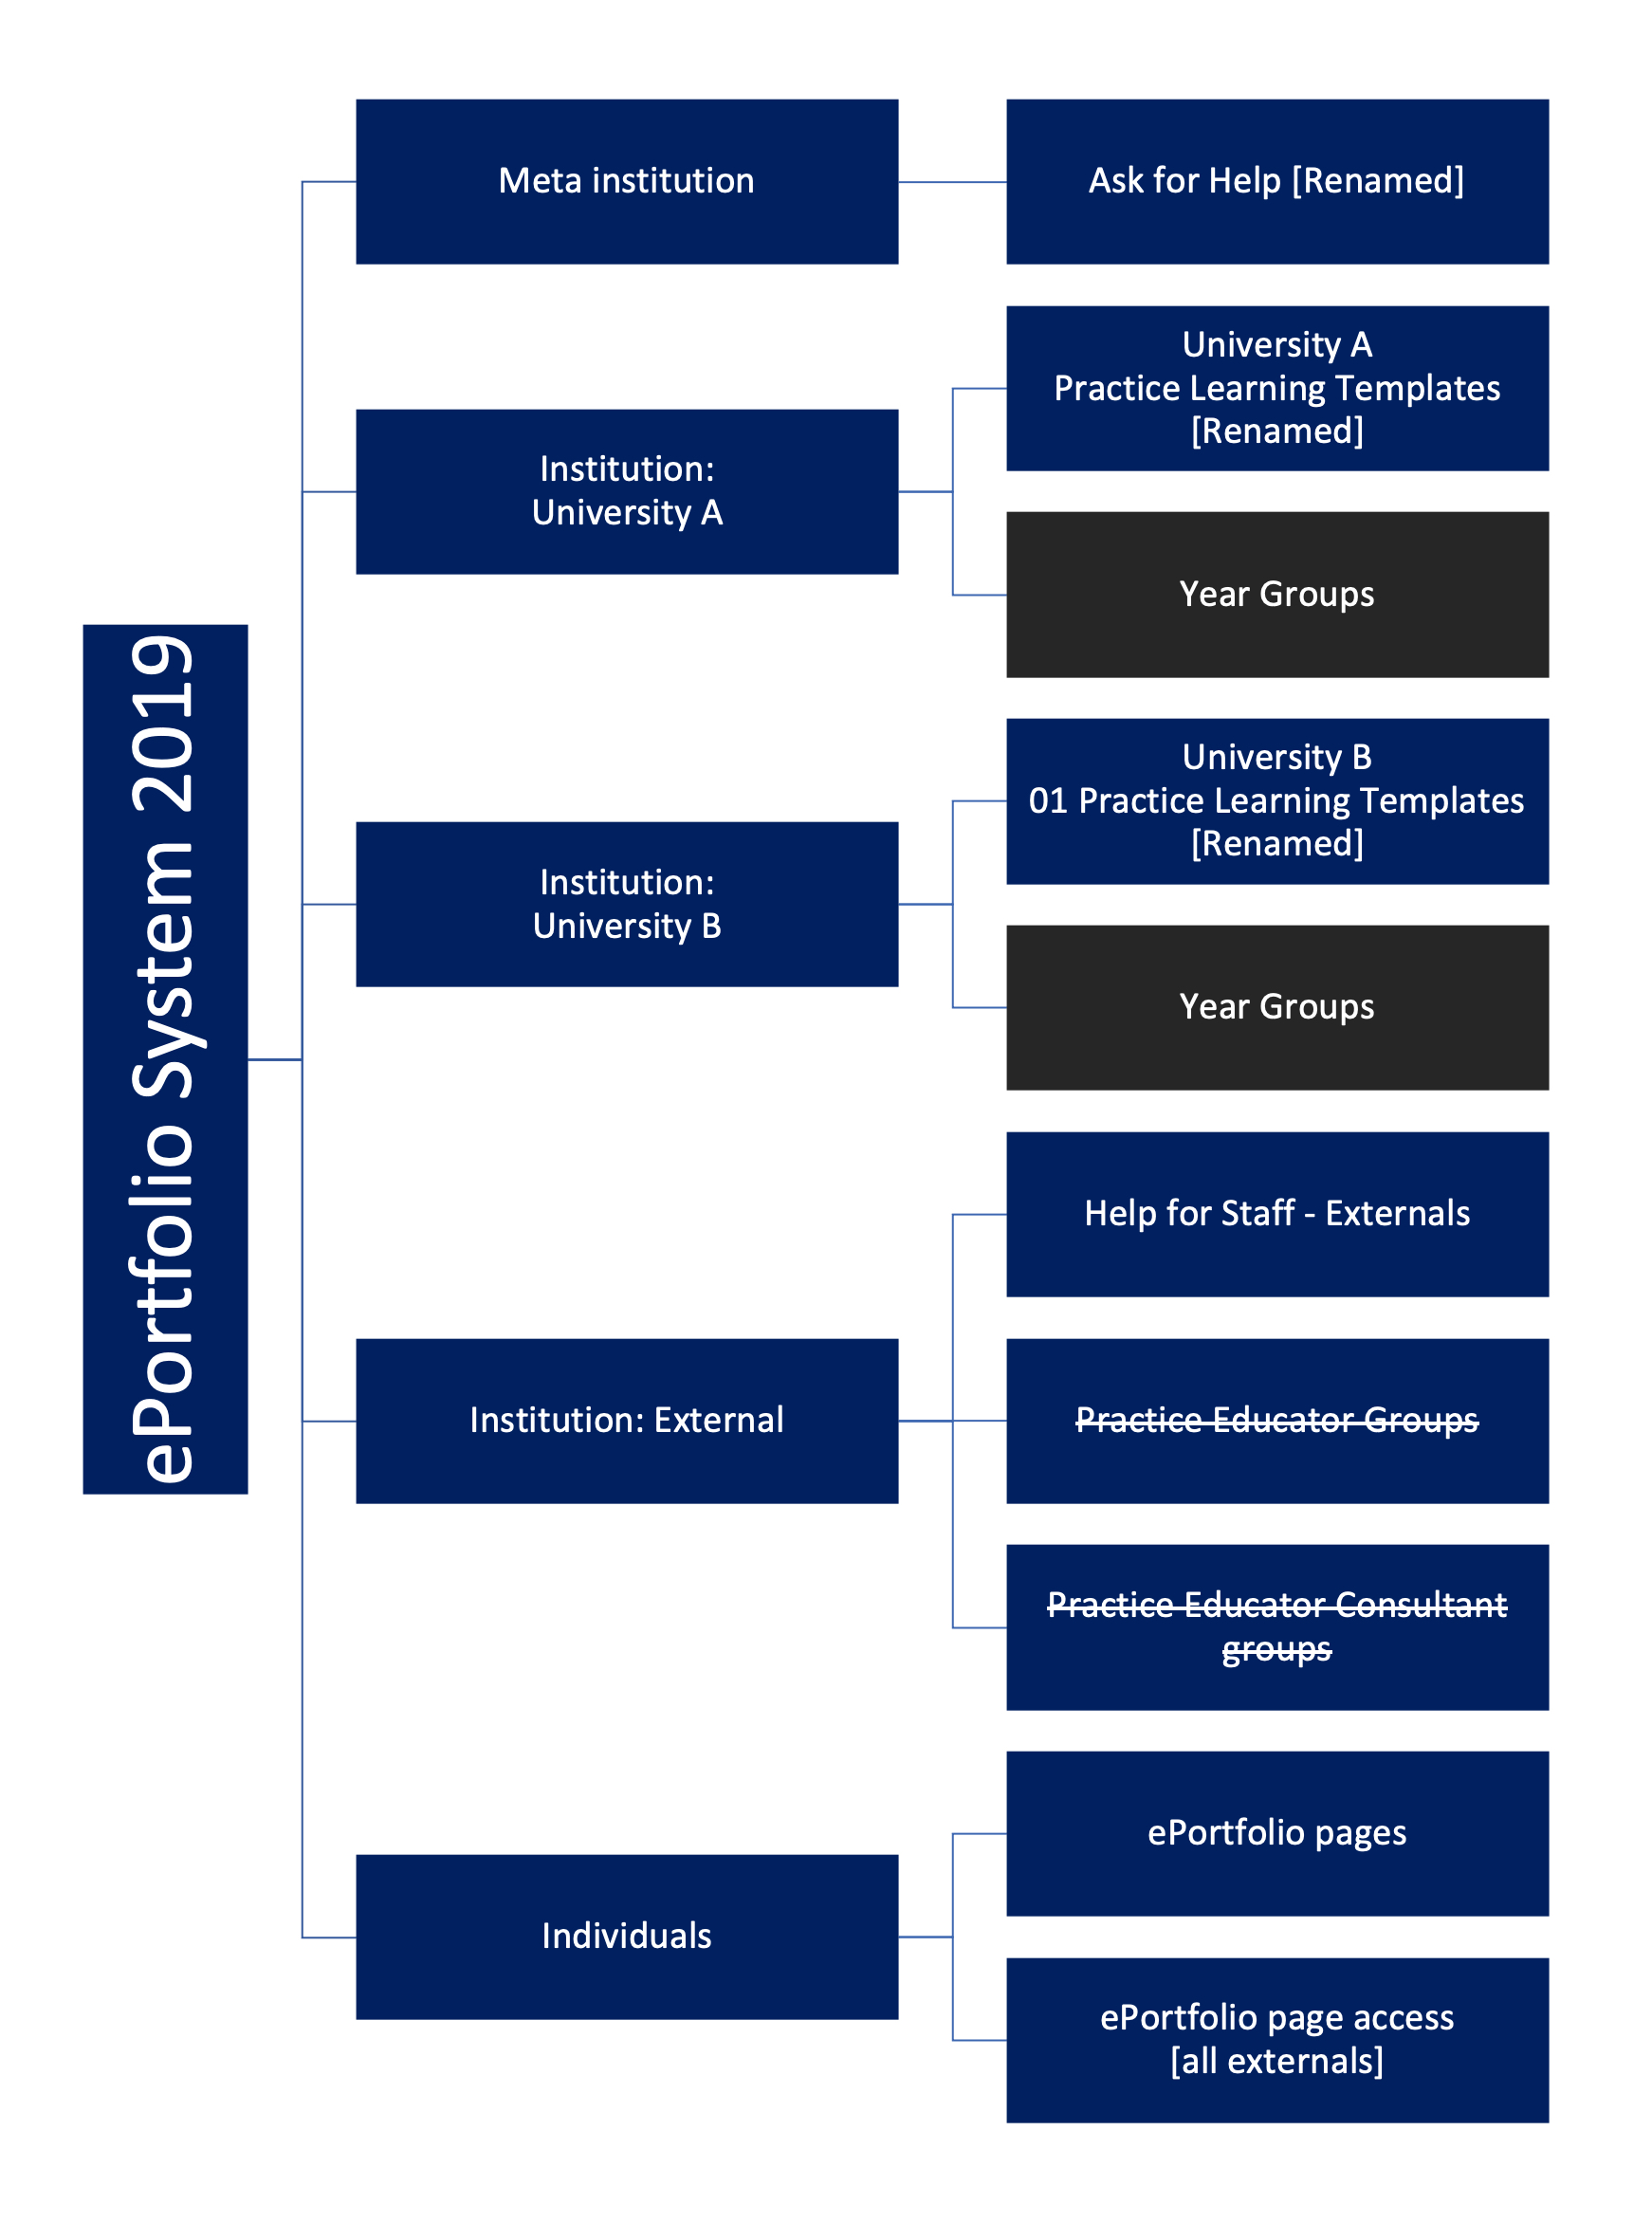
The ePortfolio system was developed in response to feedback from a regional council unit who provided student work placements and wanted to move from paper-based to digitised processes. Initially the regional council’s unit sought to setup their own ePortfolio system. As an alternative, I suggested that an economy of scale would be possible if a system that was compatible with the information systems of both local universities was setup. The value proposition was that this would help to harmonise documentation processes, providing set customer journeys per user group and therefore streamlined training across regional student placements. Furthermore, training provisions and staff resourcing could be pooled across both universities. A multi-institutional instance of Mahara (ePortfolio CMS) was setup. I built the internal information architecture and workflows based on requirements gathering with stakeholders from both universities and external placement organisations.

Objective
While delivering the training for the system, a few months into use, I met and spoke with external work placement staff who were using the system. Although feedback was positive, as compared to paper-based processes, these discussions caused me to think that the system might be more complex than it needed to be. I therefore decided to run a usability evaluation in order to test this idea.
Problem Statement
To identify usability issues with the system and validate plans to simplify the system based on receipt of additional feedback.
Roles, Methods, and Tools
I completed the usability study as a lone researcher. It therefore had to be an agile and scalable exercise, so I opted to use online questionnaires per-user group with a combination of set quantitative questions and qualitative open-text questions.
Highlighted methods/tools
- Questionnaires
- Quantitative analysis
- Qualitative analysis
- Change management (requirements and changelog)
The questionnaires were based on the ‘IBM computer usability satisfaction questionnaires’ (Lewis, 1995) with added questions allowing open-text responses. I also established a categorised list of improvements for technical consideration based on staff, student, and externals’ feedback. The initial usability in 2018 was rated by users at 58%, as compared to the benchmark of 50% for a system to be considered usable.
Project Outcome
In response to the 2018 usability study data, I made the following improvements:
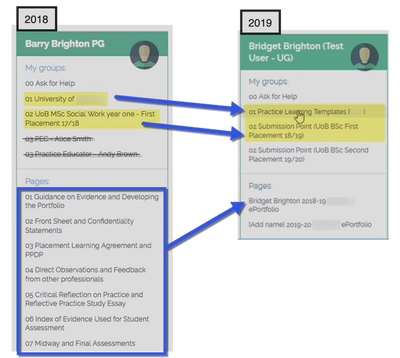
- Redesigned the student e-portfolio template, reducing it from 7 pages to 1 page with collapsible sections.
- Redesigned the internal structure and simplified the menus seen by users and by system role. My key discovery from the data was that placements are very individualised. So, although some stakeholders liked the idea of groups of students, they were not needed or used as they did not map to the students’ real-world tasks/jobs.
- Changes including clearer group naming and revisions to the electronic sign-off workflow.
Answer to Problem Statement
Question: To identify usability issues with the system and validate plans to simplify the system based on receipt of additional feedback.
Answer: Issues with e-signature workflows were uncovered. Suspected usability issues were confirmed.
Feedback
I re-ran the same usability study in September 2019, the survey response was low and unrepresentative (8.5%). Usability was rated by users at 60% (+2%). The qualitative feedback from the study suggests that the improvements may have had a more significant impact on student experience than represented by the figures.
Themes from 2019 qualitative feedback after the improvements:
Students
Staff and Externals
Reflection
Based on time and resourcing, a light touch usability evaluation had to take place. Due to the small number of responses the quantitative aspect of the questionnaire was not representative. The qualitative open-text comments, however exposed several common themes which were addressed through a programme of improvements prior to the next intake of students on the system.
Data
Due to the nature of this evaluation it is not possible to share the data. A top-level overview is provided below as a comparison of 2018 to 2019. Fewer questions were used in the 2019 questionnaire which is why the ‘possible total for usability score’ is lower.
| Usability Questionnaire Measures | 2018 | 2019 |
|---|---|---|
| Overall Possible Total for Usability Score | 42 | 35 |
| Overall Usability Score | 24 | 21 |
| Overall Usability Score | 24 | 21 |
| Overall Usability as a Percentage | 58% | 60% |
| Total Number of Users Across All Groups | 220 | 449 |
| Total Number of Respondents | 40 | 48 |
| Response Rate | 18 | 8.5 |
References
Lewis, J.R. (1995) 'IBM computer usability satisfaction questionnaires: psychometric evaluation and instructions for use', International Journal of Human-Computer Interaction, 7:1. pp. 57-78.